Market Analysis ·
Bitcoin Dominance Versus Altcoin Rotation
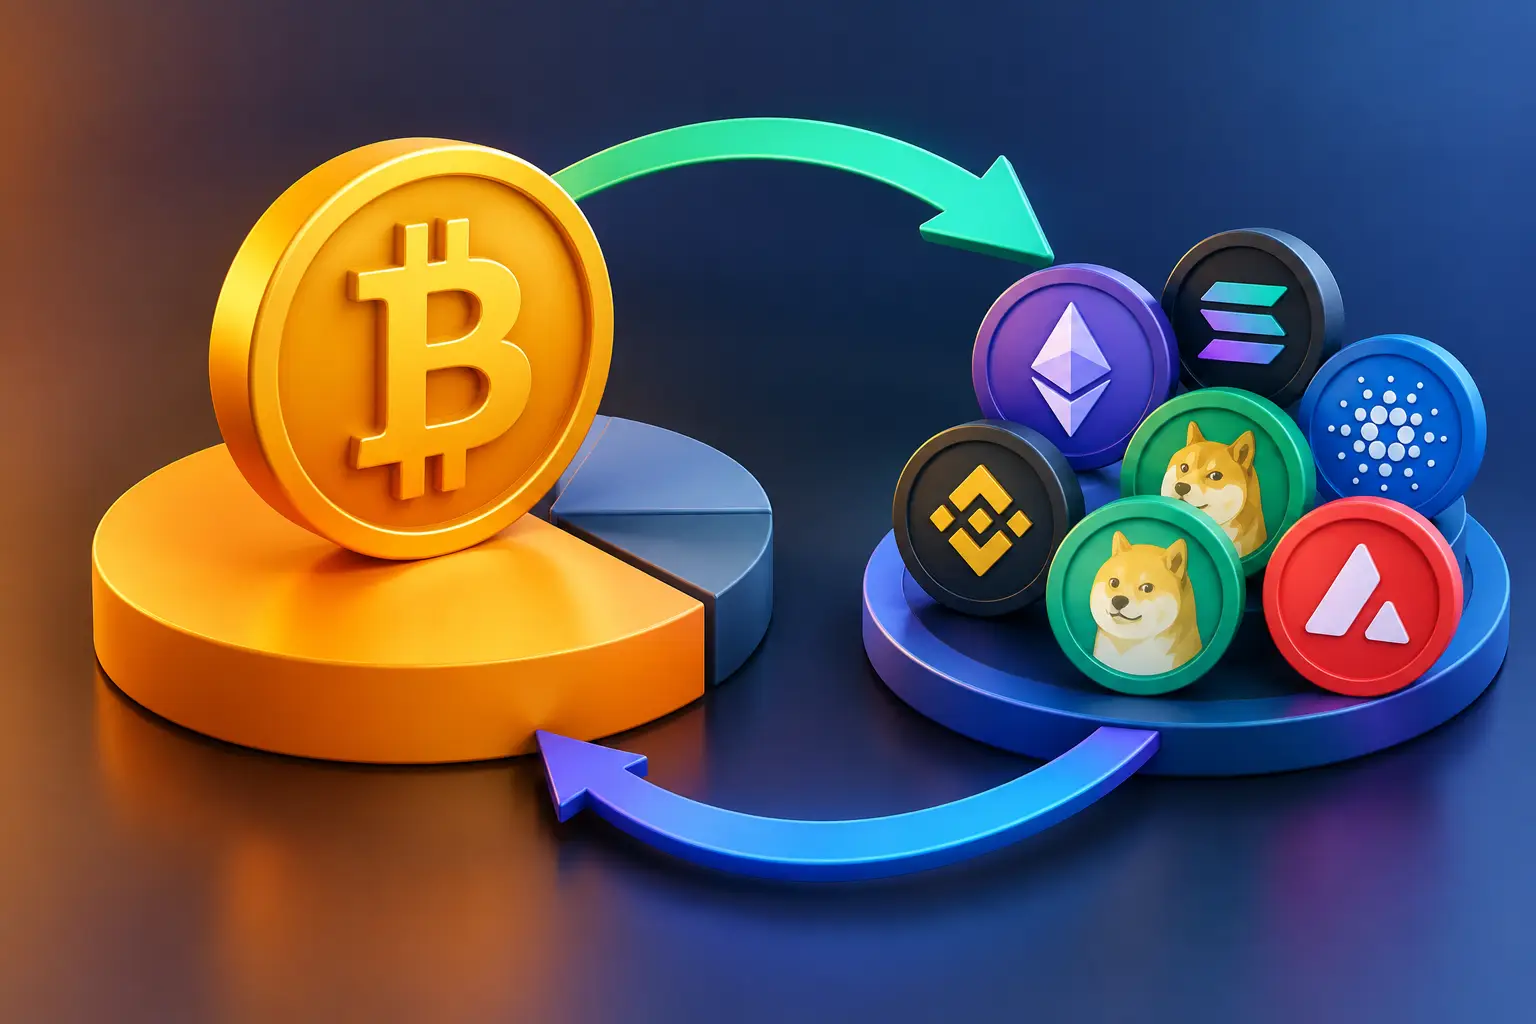
When Bitcoin rallies aggressively and most altcoins fail to follow, traders often call for an altseason too early. That is where Bitcoin dominance versus altcoin rotation becomes a practical market-reading problem, not a social-media narrative. The question is not whether capital will eventually rotate. The question is whether price and liquidity have provided evidence that rotation is underway.
Bitcoin dominance is a useful macro filter, but it is not a standalone trade signal. A dominance chart can decline while weak altcoins continue to lose value in dollar terms. It can also rise while selected sectors outperform Bitcoin. Traders who treat one percentage chart as a buy signal for every altcoin usually enter before market structure has confirmed the move.
For disciplined execution, dominance must be read alongside BTC price action, ETH/BTC behavior, stablecoin flows, total market-cap structure, and the individual altcoin's delivery from higher-timeframe liquidity.
What Bitcoin Dominance Actually Measures
Bitcoin dominance, commonly shown as BTC.D, represents Bitcoin's share of the total cryptocurrency market capitalization. When it rises, Bitcoin is gaining market-cap share relative to the broader crypto market. When it falls, non-Bitcoin assets are gaining share.
That definition matters because market-cap share is relative. BTC dominance may rise because Bitcoin is moving higher while altcoins are moving sideways. It may also rise because Bitcoin is holding stable while altcoins are selling off harder. Those are entirely different environments for risk management.
A falling dominance reading is equally nuanced. It can indicate broad risk appetite and healthy expansion into Ethereum, large-cap alts, and eventually lower-liquidity assets. But it can also fall because one major non-Bitcoin asset is rallying, while the rest of the market remains structurally weak. Traders should avoid treating BTC.D as a universal measure of altcoin strength.
The better question is: where is relative strength appearing, and is that strength supported by a clear shift in market structure?
Bitcoin Dominance Versus Altcoin Rotation: The Core Difference
Bitcoin dominance is a relative market-cap metric. Altcoin rotation is a change in capital preference. The two are connected, but they are not interchangeable.
A genuine rotation tends to move in phases. Bitcoin first attracts liquidity, often after reclaiming a key higher-timeframe level or running sell-side liquidity. Ethereum may then begin outperforming Bitcoin, visible on the ETH/BTC chart. Capital can then expand into liquid large-cap altcoins, followed by selected narratives and, late in the cycle, more speculative names.
This sequence is not guaranteed, and markets often skip stages. Still, it gives traders a framework. If Bitcoin is impulsively bullish, BTC.D is rising, and ETH/BTC remains bearish, broad altcoin exposure is usually lower quality. The market is signaling a preference for Bitcoin, not necessarily a market-wide appetite for risk.
Conversely, a decline in BTC.D becomes more actionable when BTC is consolidating or holding bullish structure, ETH/BTC has displaced higher from a meaningful discount area, and leading altcoins are breaking their own swing highs. That combination suggests capital is not simply leaving Bitcoin. It is beginning to seek higher-beta opportunities.
Start With the Higher-Timeframe Delivery
Before analyzing sector rotation, establish Bitcoin's higher-timeframe dealing range. Identify the weekly and daily swing points, external liquidity, premium and discount zones, and the nearest unmitigated order blocks. This defines the environment in which altcoins must operate.
If BTC has just swept a major high into premium pricing and shows bearish displacement on the daily chart, altcoins may not be protected by a falling dominance chart. In a broad risk-off move, altcoins often experience deeper drawdowns because their liquidity is thinner and their volatility is higher.
If Bitcoin has swept sell-side liquidity into a daily bullish order block, then delivers a [market structure shift](https://cryptoanalysislab.com/insights/crypto-market-structure-guide-for-traders) and holds above its displacement leg, the conditions are more constructive. That does not mean every altcoin should be bought. It means traders can begin looking for relative strength and clean setups rather than assuming all rallies are short-lived.
ICT methodology is useful here because it forces a sequence: liquidity event, displacement, structure shift, retracement into a defined area of interest, then execution. It replaces broad directional guessing with evidence.
Watch ETH/BTC Before Chasing the Altcoin Index
ETH/BTC is often a cleaner early indicator of meaningful rotation than an altcoin index. Ethereum is generally more liquid than smaller altcoins and frequently acts as the first major destination for capital moving beyond Bitcoin.
A bullish ETH/BTC thesis should be based on structure, not hope. Look for a sweep of sell-side liquidity, bullish displacement, a break of a meaningful lower high, and respect for a bullish [fair value gap](https://cryptoanalysislab.com/insights/beginner-guide-to-ict-concepts-for-crypto) or order block. If ETH/BTC remains in a clear bearish delivery, broad altcoin longs require greater selectivity and tighter risk.
The same logic applies to sector leaders. If a trader is interested in an AI, DeFi, or infrastructure narrative, the leading asset in that sector should show strength against both the dollar and Bitcoin. An altcoin that rises only because BTC is rising is not necessarily a rotation leader.
How to Identify a Tradable Rotation
A tradable rotation is visible in aligned evidence across several charts. It does not require perfect confirmation, but it should offer more than a single declining BTC.D candle.
First, Bitcoin should be stable or bullish on the relevant higher timeframe. Altcoins rarely sustain a broad advance when Bitcoin is in active bearish displacement. Second, ETH/BTC or another major relative-strength pair should show a confirmed market structure shift. Third, the altcoin being traded should display its own clean setup, including a liquidity sweep and displacement from an order block or fair value gap.
Finally, assess whether the asset has room to deliver. Buying directly beneath daily buy-side liquidity or into an old weekly high creates poor reward-to-risk, even during a healthy rotation. The chart may be bullish, but the entry can still be undisciplined.
This is where many traders confuse being right on the narrative with being profitable on the trade. A rotation can be real while the chosen entry is late.
Why Dominance Signals Fail in Isolation
BTC.D has several limitations that matter in execution. Stablecoin market capitalization can influence the denominator of the calculation. Large moves in Ethereum can affect dominance without confirming strength across smaller altcoins. New token issuance and changes in market-cap composition can also distort the reading.
More importantly, BTC.D does not tell you where resting liquidity sits on the chart. It does not identify an order block, validate a market structure shift, or define invalidation. Those decisions belong on the price chart.
For that reason, use dominance as a context tool rather than a trigger. It can help answer whether conditions favor Bitcoin leadership or expanding risk appetite. It cannot replace a trading model.
A trader who sees declining dominance and blindly buys ten altcoins is exposed to correlation risk, weak token selection, and poor timing. A trader who waits for relative strength, structure confirmation, and retracement into a defined PD Array has a framework for controlling risk even when the larger thesis fails.
Build a Rotation Playbook Around Risk
The most effective way to trade rotations is to define conditions before the market becomes emotional. Your plan should specify what confirms a Bitcoin-led environment, what confirms selective altcoin strength, and what would invalidate the thesis.
For example, if BTC is holding a daily bullish order block, ETH/BTC has broken structure, and a leading altcoin retraces into a four-hour fair value gap after taking sell-side liquidity, a long setup may be valid. Invalidation belongs below the defined swing low or below the order block that supports the thesis, not at an arbitrary percentage.
[Position sizing](https://cryptoanalysislab.com/insights/how-to-calculate-position-size-crypto-trades) should reflect altcoin volatility. A setup on a lower-liquidity token may need smaller size, wider invalidation, or both. Do not compensate for uncertainty by increasing leverage. Higher leverage does not improve an incomplete read of market structure.
At Crypto Analysis Lab, this distinction is central to process-driven execution: macro context creates a directional framework, but trade execution still requires a precise model. Antidote AI can support consistency in execution, yet no tool should override a clearly invalidated technical thesis.
The Practical Edge Is Selectivity
Bitcoin dominance is most valuable when it prevents bad trades. Rising BTC.D can tell you that forcing broad altcoin longs is low probability. Falling BTC.D can tell you to start scanning for relative strength, not to abandon standards.
The best rotation trades usually look obvious only after the fact. Before they expand, they often require patience while Bitcoin consolidates, ETH/BTC establishes a shift, and the chosen altcoin returns to a favorable entry zone. That waiting period is not missed opportunity. It is the work that separates a structured trader from a reactive one.
Keep the hierarchy clear: read Bitcoin for market conditions, read relative pairs for capital preference, and execute only where your individual chart provides liquidity, displacement, structure, and defined risk. Capital rotation is a market condition. Precision is the edge you bring to it.